Файл:Health care cost rise.svg
Перейти к навигации
Перейти к поиску

Размер этого PNG-превью для исходного SVG-файла: 750 × 440 пкс. Другие разрешения: 320 × 188 пкс | 640 × 375 пкс | 1024 × 601 пкс | 1280 × 751 пкс | 2560 × 1502 пкс.
Исходный файл (SVG-файл, номинально 750 × 440 пкс, размер файла: 15 КБ)
Этот файл находится на Викискладе. Сведения о нём показаны ниже.
Викисклад — централизованное хранилище для свободных файлов, используемых в проектах Викимедиа.
|
Краткое описание
| Описание |
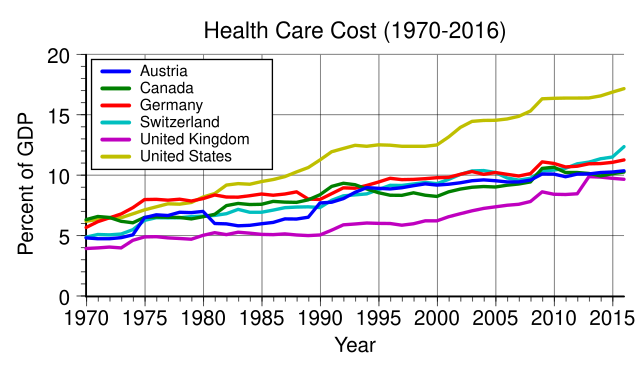
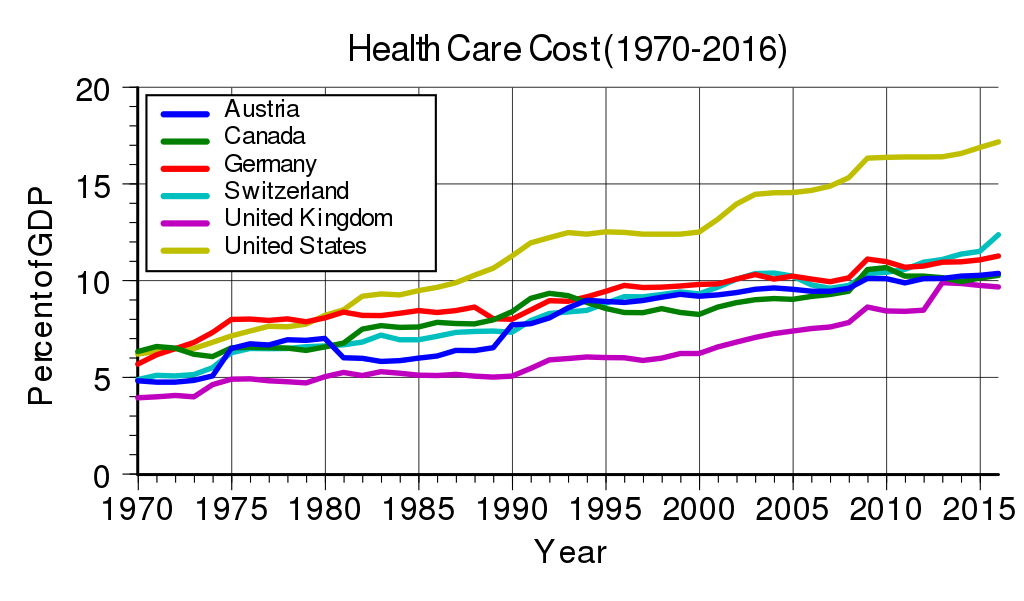
English: Health care cost rise based on total expenditure on health as percent of GDP. Countries are USA, Germany, Austria, Switzerland, United Kingdom, and Canada. See: OECD iLibrary. Health expenditure and financing. And: OECD Data. Health resources - Health spending . See also: en:List of countries by total health expenditure per capita. |
| Дата | (date of first version of the chart here on the Commons). |
| Источник | Собственная работа |
| Автор | WikiBasti |
| Другие версии | Health care cost rise.PNG |
| SVG‑разработка | Это векторное изображение было создано с помощью Other tools Этот файл использует встроенный текст, который можно легко перевести через текстовый редактор. |
Generated with Wikimedia SVG Chart
| Data format | The source data of the chart is in the SVG image file in a clearly readable format. You see the original numbers inside of the SVG file in the form of a list such as this:
... 1995 10.06 1996 11.75 1997 12.45 ... |
| Content of SVG | To view the data download the SVG file itself. To do so right-click this link, and then choose the option to save: File:Health care cost rise.svg. Launch any text editor. Open the downloaded SVG file with the text editor (usually; file menu, open). To see the list of data, search for the phrase id="graph1". |
| Please, do not use a special SVG editor such as Inkscape; the readability of the database would be destroyed. You can edit the SVG file with any text editor, for example; en: List of text editors. You can view the edited SVG file in various web browsers. As of 2011, all major desktop browsers, and many minor ones, have some level of SVG support. See: en: Scalable Vector Graphics#Support for SVG in web browsers. When satisfied with your edits, upload the edited SVG file with the link labeled "Upload a new version of this file".
W3C-validity not checked. This chart was created with Wikimedia SVG Chart. Этот файл использует встроенный текст/цифры. |
|
| Code to generate SVG | See: File talk:Health care cost rise.svg. Documentation see: Wikimedia SVG Chart. |
Лицензирование
| Я, владелец авторских прав на это произведение, передаю его в общественное достояние. Это разрешение действует по всему миру. В некоторых странах это не может быть возможно юридически, в таком случае: Я даю право кому угодно использовать данное произведение в любых целях без каких-либо условий, за исключением таких условий, которые требуются по закону. |
История файла
Нажмите на дату/время, чтобы посмотреть файл, который был загружен в тот момент.
| Дата/время | Миниатюра | Размеры | Участник | Примечание | |
|---|---|---|---|---|---|
| текущий | 21:10, 8 октября 2017 | | 750 × 440 (15 КБ) | Delphi234 | update |
| 15:15, 11 сентября 2016 |  | 750 × 440 (15 КБ) | Delphi234 | update | |
| 02:02, 17 мая 2016 |  | 750 × 440 (15 КБ) | Delphi234 | update | |
| 13:15, 24 марта 2010 |  | 896 × 420 (30 КБ) | WikiBasti | different size | |
| 13:13, 24 марта 2010 | 860 × 240 (30 КБ) | WikiBasti | different size | ||
| 12:44, 24 марта 2010 |  | 512 × 240 (30 КБ) | WikiBasti | {{Information |Description={{en|1=Data Source [http://www.irdes.fr/EcoSante/DownLoad/OECDHealthData_FrequentlyRequestedData.xls] (OECD Health Data 2009). Health care cost rise based on total expenditure on health as % of GDP. Countries are USA, Germany, A |
Использование файла
Следующая страница использует этот файл:
Глобальное использование файла
Данный файл используется в следующих вики:
- Использование в ar.wikipedia.org
- Использование в az.wikipedia.org
- Использование в de.wikipedia.org
- Использование в en.wikipedia.org
- Использование в es.wikipedia.org
- Использование в fa.wikipedia.org
- Использование в ja.wikipedia.org
- Использование в ko.wikipedia.org
- Использование в pl.wikipedia.org
- Использование в pt.wikipedia.org
- Использование в sr.wikipedia.org
- Использование в sv.wikipedia.org
- Использование в zh.wikipedia.org