Файл:Illustration of causal and non-causal filters.svg
Перейти к навигации
Перейти к поиску

Размер этого PNG-превью для исходного SVG-файла: 664 × 599 пкс. Другие разрешения: 266 × 240 пкс | 532 × 480 пкс | 851 × 768 пкс | 1135 × 1024 пкс | 2269 × 2048 пкс | 688 × 621 пкс.
Исходный файл (SVG-файл, номинально 688 × 621 пкс, размер файла: 65 КБ)
Этот файл находится на Викискладе. Сведения о нём показаны ниже.
Викисклад — централизованное хранилище для свободных файлов, используемых в проектах Викимедиа.
|
Краткое описание
| Описание |
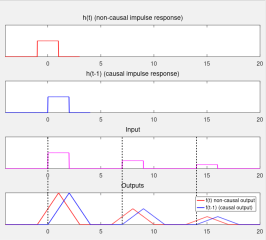
English: Each component of the causal filter output begins when its stimulus begins. The outputs of the non-causal filter begin before the stimulus begins. |
|||
| Дата | (UTC) | |||
| Источник |
Этот файл является производной работой от: Illustration of causal and non-causal filters.png |
|||
| Автор | Bob K | |||
| Права (Повторное использование этого файла) |
Я, владелец авторских прав на это произведение, добровольно публикую его на условиях следующей лицензии:
|
|||
| SVG‑разработка | Это векторное изображение было создано с помощью LibreOffice |
|||
| Gnu Octave source | click to expand
This graphic was created with the help of the following Octave script: % Options
frame_background_gray = true;
if frame_background_gray
graphics_toolkit("qt") % has "insert text" option
% graphics_toolkit("fltk") % has cursor coordinate readout
frame_background = .94*[1 1 1];
d = 4; % amount to add to text sizes
else
graphics_toolkit("gnuplot") % background will be white regardless of value below
frame_background = .94*[1 1 1];
d=0;
endif
xmax = 1000; % length of plots
L = 100; % length of rectangles
% (https://octave.org/doc/v4.2.1/Graphics-Object-Properties.html#Graphics-Object-Properties)
% Speed things up when using Gnuplot
set(0, "DefaultFigureColor",frame_background)
set(0, "DefaultAxesTitleFontweight","normal")
set(0, "DefaultAxesFontsize",12+d) % size of numeric tick labels
% set(0, "DefaultTextFontsize",12+d)
set(0, "DefaultAxesYlim",[0 2])
set(0, "DefaultAxesXlim",0.02*([-200 xmax]))
set(0, "DefaultAxesYtick",[])
set(0, "DefaultLineLinewidth",2)
%=======================================================
hfig = figure("position",[1 -150 735 835]);
x1 = .02; % left margin
x2 = .02; % right margin
y1 = .08; % bottom margin for annotation
y2 = .10; % top margin for title
dy = .10; % vertical space between rows
width = 1-x1-x2;
height= (1-y1-y2-3*dy)/4; % space allocated for each of 4 rows
x_origin = x1;
y_origin = 1; % start at top of graph area
%=======================================================
y_origin = y_origin -y2 -height; % position of top row
subplot("position",[x_origin y_origin width height])
f = [zeros(1,200) ones(1,L) zeros(1,100)];
plot(0.02*([1:length(f)]-250), f ,"r" )
title("h(t) (non-causal impulse response)", "fontsize",14+d)
%=======================================================
y_origin = y_origin -dy -height;
subplot("position",[x_origin y_origin width height])
plot(0.02*([1:length(f)]-200), f, "b" )
title("h(t-1) (causal impulse response)", "fontsize",14+d)
%=======================================================
y_origin = y_origin -dy -height;
subplot("position",[x_origin y_origin width height])
a = [zeros(1,200) ones(1,L) zeros(1,250) 0.5*ones(1,100) zeros(1,250) 0.25*ones(1,100) zeros(1,200)];
plot(0.02*([1:length(a)]-200), a,"m")
ylim([0 2*max(a)])
title("Input", "fontsize",14+d)
%=======================================================
y_origin = y_origin -dy -height;
subplot("position",[x_origin y_origin width height])
b = conv(a,f);
c = b(200:end);
plot(0.02*([1:length(c)]-250), c, "r", 0.02*([1:length(c)]-200), c, "b")
ylim([0 max(b)])
legend("f(t) non-causal output", "f(t-1) (causal output)")
title("Outputs", "fontsize",14+d)
print -dsvg Illustration_of_causal_and_non-causal_filters.svg
|
Исходный журнал загрузок
This image is a derivative work of the following images:
- File:Illustration_of_causal_and_non-causal_filters.png licensed with PD-user
- 2012-01-07T02:20:59Z OgreBot 1470x1671 (32150 Bytes) (BOT): Reverting to most recent version before archival
- 2012-01-07T02:20:55Z OgreBot 483x585 (6466 Bytes) (BOT): Uploading old version of file from en.wikipedia; originally uploaded on 2005-12-12 00:25:17 by [[:en:User:Bob K|Bob K]]
- 2012-01-07T02:20:53Z OgreBot 441x659 (5782 Bytes) (BOT): Uploading old version of file from en.wikipedia; originally uploaded on 2005-12-11 23:47:49 by [[:en:User:Bob K|Bob K]]
- 2012-01-07T02:20:51Z OgreBot 429x635 (5727 Bytes) (BOT): Uploading old version of file from en.wikipedia; originally uploaded on 2005-12-11 23:34:00 by [[:en:User:Bob K|Bob K]]
- 2012-01-06T13:35:34Z Bob K 1470x1671 (32150 Bytes) {{BotMoveToCommons|en.wikipedia|year={{subst:CURRENTYEAR}}|month={{subst:CURRENTMONTHNAME}}|day={{subst:CURRENTDAY}}}} The upload bot is [[User:CommonsHelper2 Bot]] which is called by [http://toolserver.org/~commonshelper2/in
История файла
Нажмите на дату/время, чтобы посмотреть файл, который был загружен в тот момент.
| Дата/время | Миниатюра | Размеры | Участник | Примечание | |
|---|---|---|---|---|---|
| текущий | 08:52, 2 февраля 2020 | | 688 × 621 (65 КБ) | Bob K | minor cleanup |
| 19:06, 1 февраля 2020 |  | 688 × 642 (66 КБ) | Bob K | change frame background from white to gray | |
| 17:39, 7 августа 2012 |  | 512 × 579 (107 КБ) | Zerodamage | == {{int:filedesc}} == {{Information |Description={{en|Each component of the causal filter output begins when its stimulus begins. The outputs of the non-causal filter begin before the stimulus begins}} |Source={{Derived from|Illustration_of_causal_and... |
Использование файла
Следующая страница использует этот файл:
Глобальное использование файла
Данный файл используется в следующих вики:
- Использование в ar.wikipedia.org
- Использование в en.wikipedia.org